Last week I had the opportunity of sitting in on a Program Coordination and Management Committee Meeting for UNICEF. A good portion in the beginning was devoted to your basic logistics and updates within the department. Interesting to see how a massive program like UNICEF is managed but let’s be honest, it is still a bit boring. Luckily the meeting picked up with the scheduled presentations by Cary, Program Manager for U-Report and Diego, M&E specialist for Social Policy and Planning. I’m under the impression these are scheduled to keep everyone in the know about what’s happening in those sectors. This blog will cover Diego’s presentation.
UNICEF’s Social Policy and Planning Department alongside the Ministry of Finance, specifically the Budget and Monitoring Committees, are not only responsible for the provision of funds and programs but for the effective implementation of those funds as well. Allocation and appropriation are only the first steps. Monitoring and evaluating is the crucial if we want to ensure our money (whether it be aid or government) is doing what it is supposed to do.
But it seems that everyone is debating and struggling with how to do this best. Some search for hard evidence and look to sector indicators to show improvements or stalemates, while others push for a more qualitative approach to see how to measure this progress. Diego took us though their traditional method to monitoring with a focus on Karamoja, a region in Uganda which received well-endowed education funding but on the low end of the spectrum in terms of performance. We want to know why? and we want to know so we can change it to use our funds more efficiently and effectively.
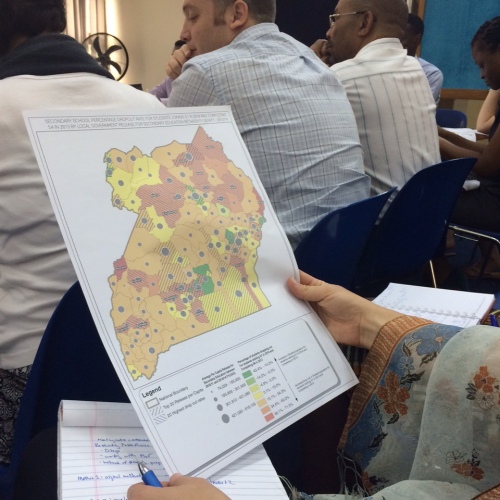
STEP 1: The starting point seems to be to follow the money trail. A – $$$$$$ – B. It’s easiest if we create a visual landscape for ourselves to see how the budget and funding breaks down on a sub-national basis and compare it to sector performance indicators. This is where those maps come in handy. The picture below showcases this exact idea; per capita expenditure mapped against school dropout rates. And viola! Certain districts have a clear contrast between the two. This tension between funds and failure kicks off our monitoring investigation.
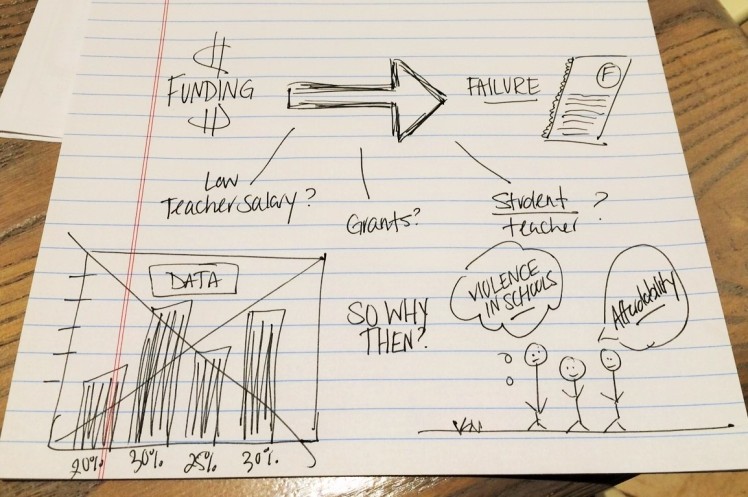
STEP 2: Now we begin to look at the district level indicators to attempt to find where this tension stems from. First, we look at the average number of pupils per classroom. Could overcrowded classrooms be the problem to high dropout rates and poor performances? The numbers say no. This district shows no significant difference to other good performing districts. Okay, perhaps number of pupils per teacher then. Could a lack of attention and dismal student: teacher be the culprit? Nope. The education level of a teacher? Nope. Facility Grants? Teacher Salaries? Poor inspections and collection of the data that is telling us all these indicators? No, no, and no. So what is it then? What if the numbers just don’t tell us enough?
STEP 3: Diego and his team could not crack the code with the numbers alone. They wanted needed to know what the people are saying. Enter U-Report data from stage right. They go to the data that has been collected by Karamoja citizens who have answered poll questions regarding the education sector and find a clear thread among the responses. People are consistently talking about violence in schools and the affordability. Uganda’s national spending on education is lower than global standards but perhaps it is not the issue of money that will determine poor/high performances. It’s not always about the money.
STEP 4: These new pieces of information are crucial to the investigation. It changes the focus and shifts the conversation. The infield monitoring team can now head to the districts and investigate some of the issues highlighted from the U-Report data. The idea then is to incorporate these findings into the budget planning process as well as disseminate the information to donors providing grants. One can then look at the education budget breakdown and though it is quite prioritized, one can find some room for shifting resources from say school construction or provision of supplies to family involvement services or community action interventions. This is the tricky part; it’s much easy to buy bricks and books than it is to change behavior or even attempt to alter a culture. This calls for well beyond data crunching and data dives from a line ministry office. An involvement of facility managers and local leaders is crucial for the success of this process and eventually intervention.
The difficulty in what the education sector now faces is a total market failure/market breakdown. The laws are there. The people to follow them are there. The positions to enforce them are there, at least on the books. But accountability is not. Therefore how does one begin to change behavior with a government budget? It is not an easy question to answer but we must continue to ask these questions. We must continue to ask why certain things are happening around us…or why they are not. Money is only the first step.
It all seems so simple, right? Incorporate the people’s voices into the planning. But with the power, the pennies, and the pen all concentrated within the central government, hearing from these hard to reach populations is not as simple as it sounds and listening is even more difficult. The goal is to create a norm, a norm in which these citizen feedback is automatically built into the planning process – to eventually have this feedback on a smartphone application so policy makers, politicians, and planners all have it right in their pockets. To allow us to know the real issue so we can know the best intervention and therefore reach that original intention.

